

The price of Bitcoin traded at a new all-time high above $ 66,800 before correcting down against the US dollar. BTC has traded below $ 63,000 and it remains exposed to further downside risk.
- Bitcoin broke above the resistance levels of $ 65,000 and $ 66,000 before correcting lower.
- The price is now trading below $ 63,000 and the 100 hour simple moving average.
- There was a break below a major uptrend line with support near $ 63,200 on the hourly chart of the BTC / USD pair (Kraken data feed).
- The pair could accelerate lower if it stays below the pivot level of $ 64,000.
Bitcoin price corrects downward
The price of Bitcoin has extended its rise above the resistance zone of $ 65,000. BTC even broke $ 66,000 and traded at a new all-time high near $ 66,982.
Recently there was a downward correction below the $ 65,000 support level. There was also a break below a major uptrend line with support near $ 63,200 on the hourly chart for the BTC / USD pair. The pair is now trading below $ 63,000 and the 100 hour simple moving average.
A low formed near $ 62,050 and it is now consolidating losses. Immediate resistance is near the $ 63,200 level. It is near the 23.6% Fib retracement level of the downward movement from the high of $ 66,982 to the low of $ 62,050.
The 100-hour SMA is also positioned just above the $ 63,200 level. A clear break above the resistance of $ 63,200 could open the door for a further rise. The next major resistance is near the $ 64,500 level, above which the price may rise to the $ 66,000 level.
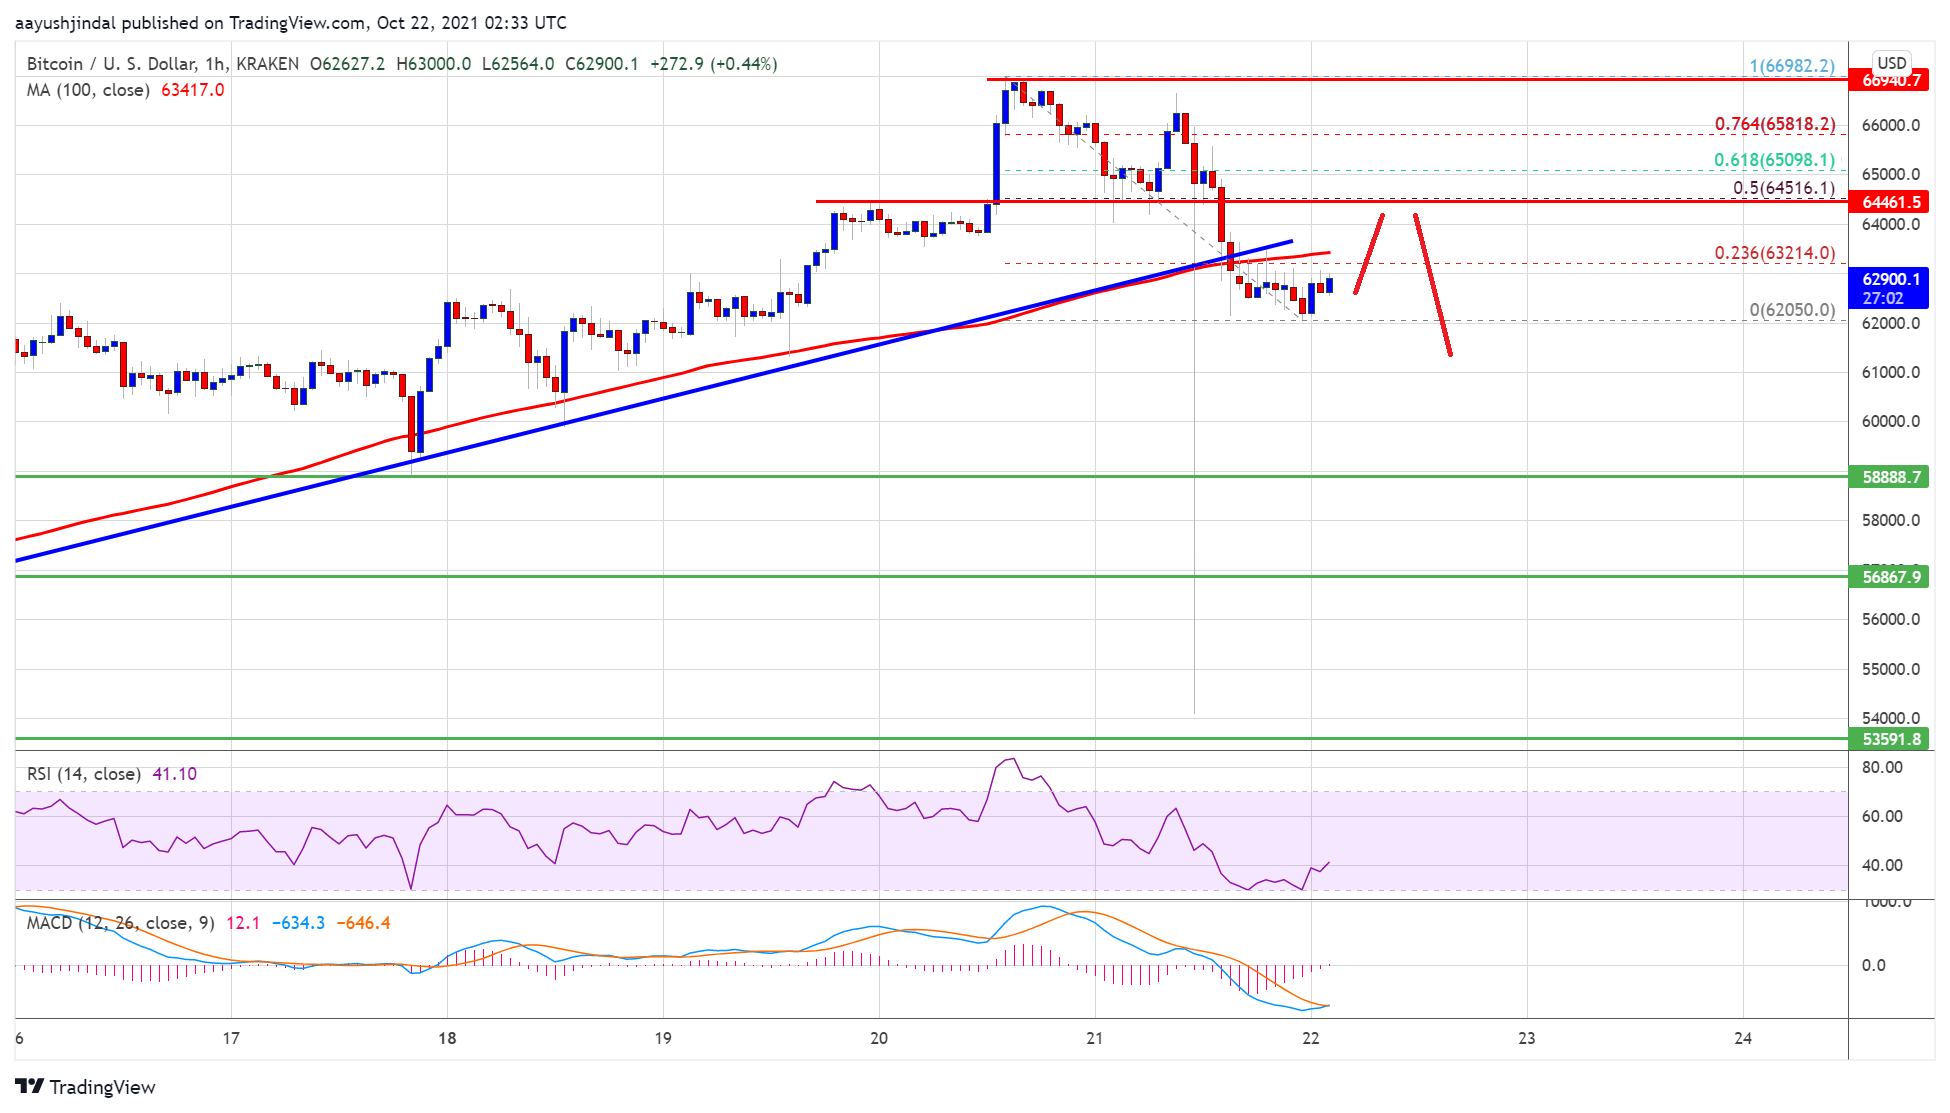
Source: BTCUSD on TradingView.com
The resistance of $ 64,500 is near the 50% Fib retracement level of the downward movement, moving from the high of $ 66,982 to the low of $ 62,050. Further gains could eventually call for a new all-time high above the $ 67,000 level in the near term.
More losses in BTC?
If bitcoin fails to break through the resistance zone of $ 63,200, it could extend its downward correction. Immediate downside support is near the $ 62,200 level.
First major support is now forming near the $ 62,000 level. A break below the $ 62,000 support could eventually push the price towards the $ 60,000 support area.
Technical indicators:
Hourly MACD – The MACD is now losing momentum in the bearish zone.
Hourly RSI (Relative Strength Index) – The RSI for BTC / USD is now below level 50.
Major Support Levels – $ 62,200, followed by $ 62,000.
Major Resistance Levels – $ 63,200, $ 64,500 and $ 66,000.


