
Bitcoin price extended its rally above $49,000 against the US Dollar. BTC may continue to rise and may cross the $50,000 resistance in the near term.
- Bitcoin rose above the $47,500 and $48,500 resistance levels.
- The price is now trading above $48,000 and the 100 hourly simple moving average.
- There is a major bullish trend line forming with support near $48,400 on the hourly chart of the BTC/USD pair (data feed from Kraken).
- The pair could correct lower, but it could find support near $47,400 or $47,000.
Bitcoin price is still on the rise
Bitcoin price started a strong increase above the $46,500 resistance level. BTC broke the $47,500 resistance and settled above the 100 hourly simple moving average.
It even jumped above $49,000 before correcting lower. However, the downside was limited below the $46,500 support area. A bottom was formed near $46,895 and the price started a new increase. It rose above the $47,500 and $48,500 resistance levels.
Bitcoin is now trading above $48,000 and a 100 hourly simple moving average. A high was formed near $49,750 and it is now consolidating its gains. There is immediate support on the downside near the $49,000 level.
It is close to the 23.6% Fib retracement level of the latest wave from the $46,895 swing low to $49,750. There is also a major bullish trend line forming with support near $48,400 on the hourly chart of the BTC/USD pair.
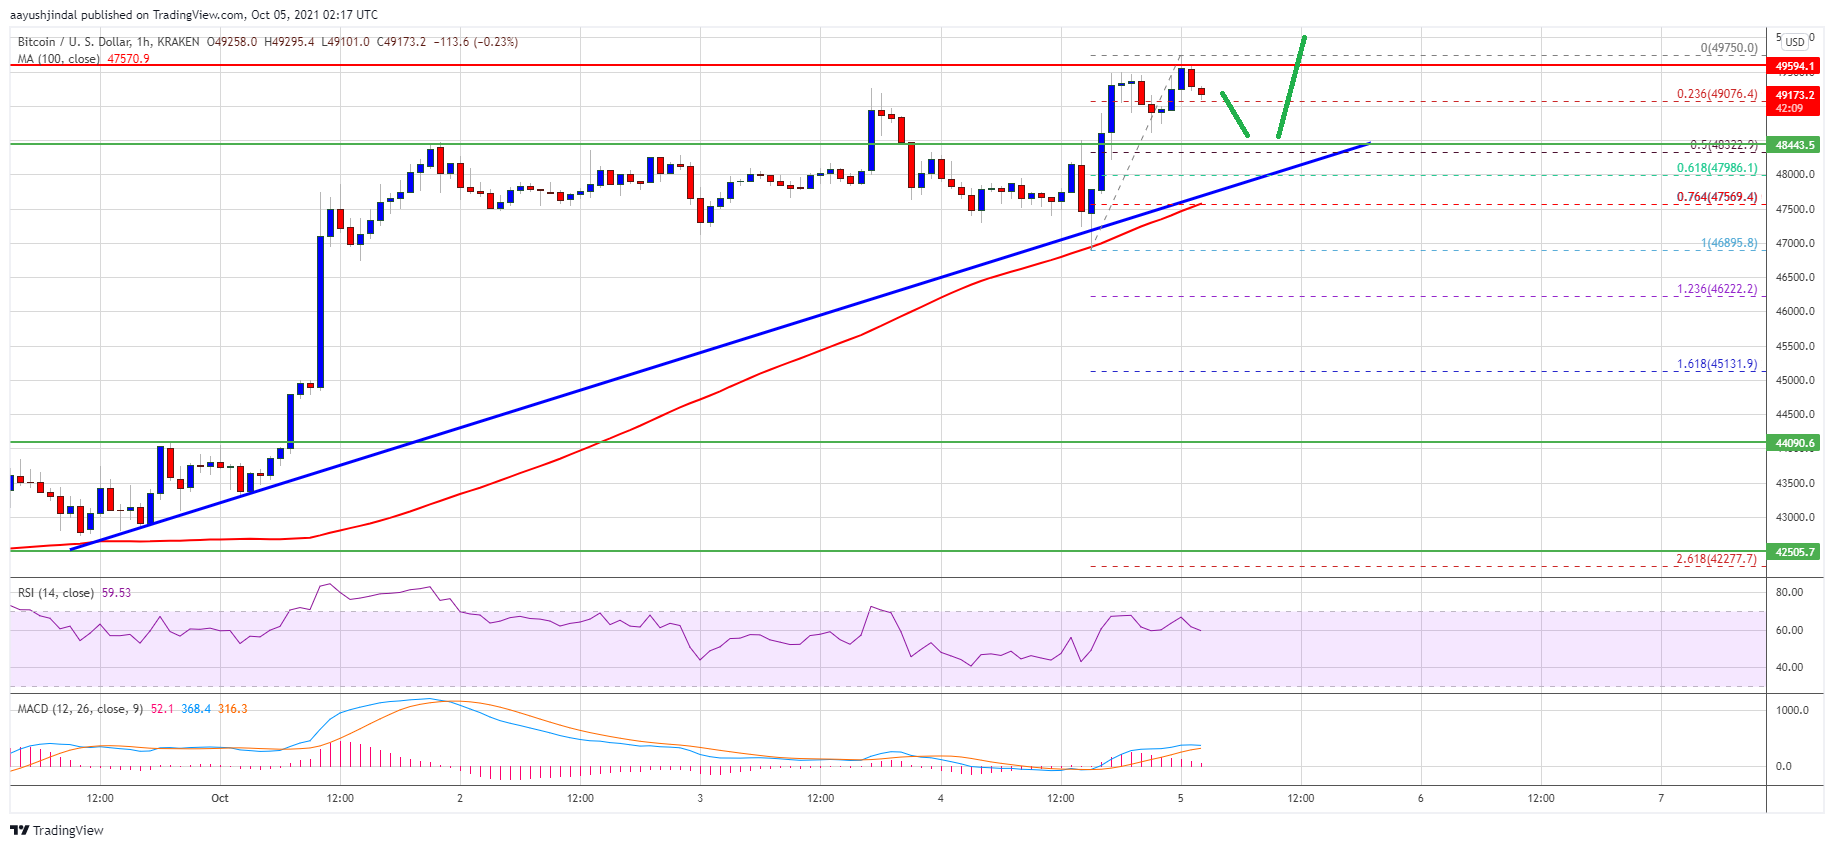
Source: BTCUSD on TradingView.com
On the upside, there is an immediate resistance near the $49,600 level. The first major resistance is near the $49,750 level, above which the price could reach $50,000. A close above the $50,000 level could trigger another increase in the near term. The next major stop for the bulls could be near the $52,000 level.
Limited Bitcoin dip?
If Bitcoin fails to break above the $50,000 resistance area, it may start a new bearish correction. There is immediate support on the downside near the $49,000 level.
The first major support is now forming near the $48,400 level and the trend line. It is close to the 50% Fib retracement level of the last wave from the $46,895 swing low to $49,750. A break below trend line support could push the price towards the $47,550 level and the 100-hour simple moving average.
Technical indicators:
Hourly MACD The MACD is now losing momentum in the bullish zone.
Hourly RSI (Relative Strength Index) – The RSI for BTC/USD is well above the 50 level.
Key support levels – $48,400, followed by $47,550.
Key resistance levels – $49,500, $50,000 and $52,000.


