

Ethereum started steadily increasing above $3,250 and $3,300 against the US Dollar. ETH price is now struggling to gain ground above $3,400 and $3,450.
- Ethereum started a bearish correction after it encountered sellers near the $3,500 region.
- The price is now trading above $3,200 and the 100 hourly simple moving average.
- There was a breakout above the descending channel with resistance near $3380 on the hourly chart of ETH/USD (data feed via Kraken).
- The pair could start a new increase if it remains stable above the $3,275 support level.
Ethereum price hike
Ethereum gained strength to move above the $3,200 level. ETH even rose above the $3,300 level and the 100 hourly simple moving average. However, the price failed near the $3,500 area.
A top formed near $3,489 before there was a downside correction, similar to Bitcoin. The price corrected lower below the $3,350 support level. However, the bulls were active near the $3,275 level and the 100 hourly simple moving average.
A bottom was formed near $3,275 and the price started a new increase. There was a break above the $3,350 resistance level. Ether rose above the 50% Fib retracement level of the downside move from the $3,489 swing high to $3,275 low.
There was also a break above the descending channel with resistance near $3380 on the hourly chart of ETH/USD. It is now consolidating near the $3380 area.
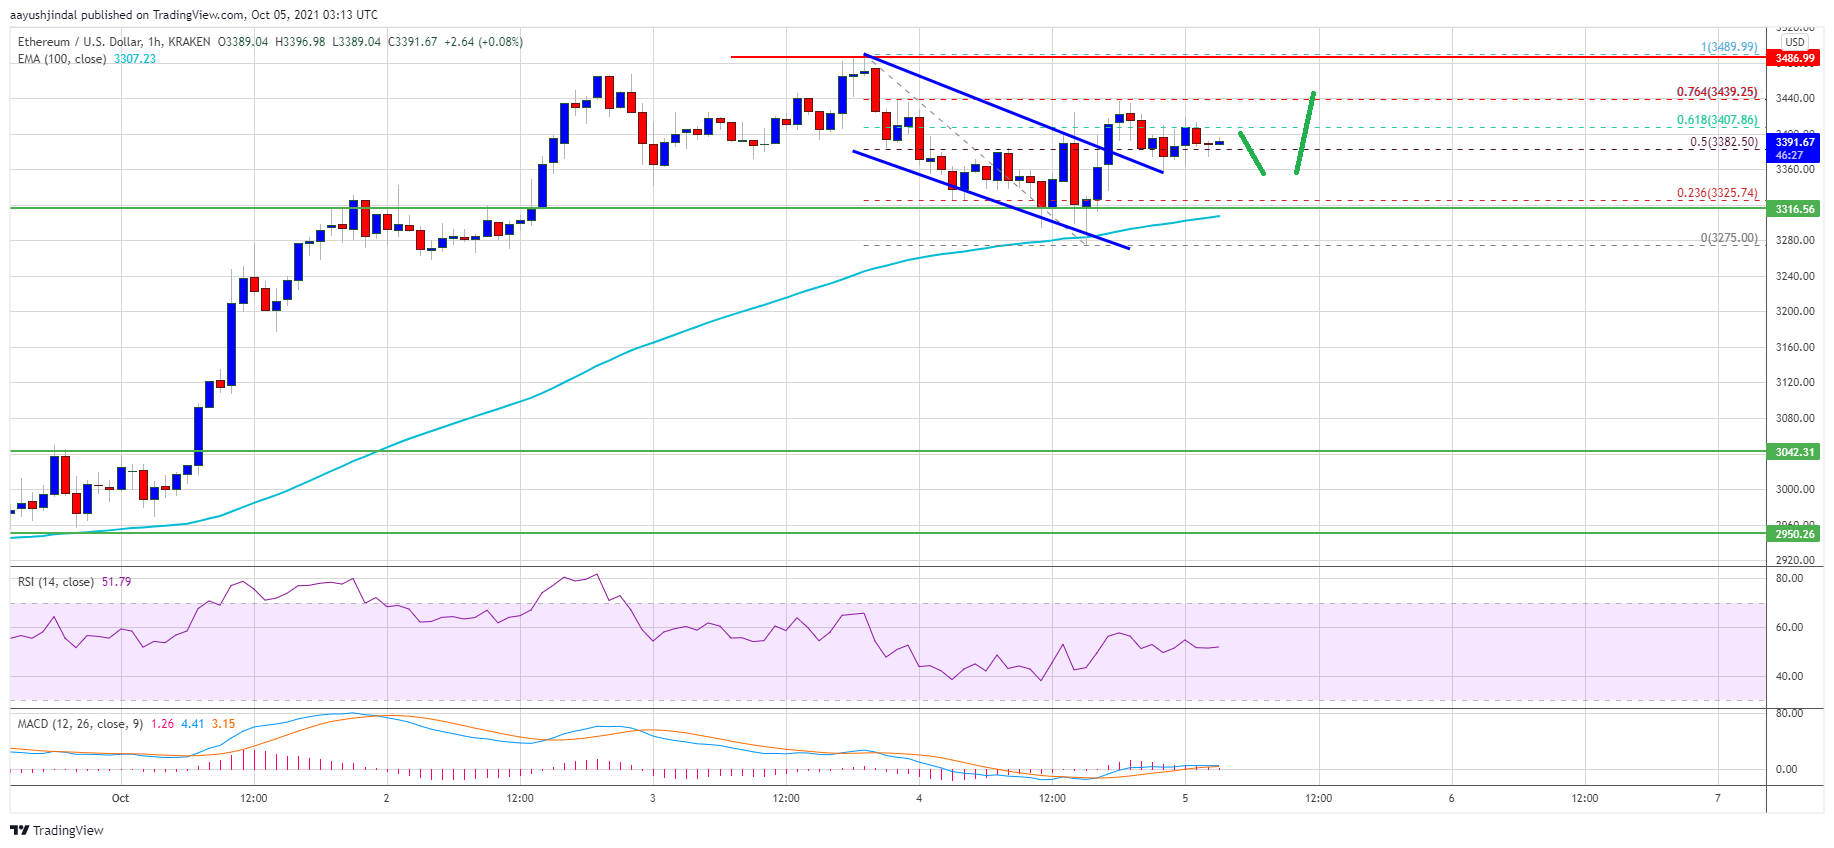
Source: ETHUSD on TradingView.com
There is an immediate resistance on the upside near the $3,420 level. The first major resistance is near the $3,440 level. It is near the 76.4% Fib retracement level of the downside move from the $3,489 swing high to $3,275 low. The next major resistance is near the $3,500 level, when above it, the price could accelerate towards $3,700.
Dips Limited in ETH?
If Ethereum fails to continue rising above the $3,420 and $3,440 resistance levels, it may start a new downside correction. There is initial support on the downside near the $3350 level.
The first major support is now forming near the $3,300 level and the 100 hourly simple moving average. If Ether fails to stay above $3,300 and $3,275, it may continue to decline. The next major support might be near the $3,200 level.
Technical Indicators
MACD per hour – ETH/USD’s MACD is now losing momentum in bullish territory.
Hourly RSI – The RSI for ETH/USD is just above the 50 level.
Key Support Level – $3,275
Key Resistance Level – $3,440


