
Ethereum corrects gains of $ 4,121 against the US dollar. The price of ETH could start a further rise if there is a clear break above the resistance of $ 4,040.
- Ethereum struggled to break through the $ 4,100 zone and corrected lower.
- The price is trading just above $ 3,950 and the 100 hour simple moving average.
- There was a break below a key bullish channel with support near $ 4,040 on the ETH / USD hourly chart (data feed via Kraken).
- The pair could start a further rise if it stays above the $ 3,920 support and 100 hour SMA.
Ethereum price corrects lower
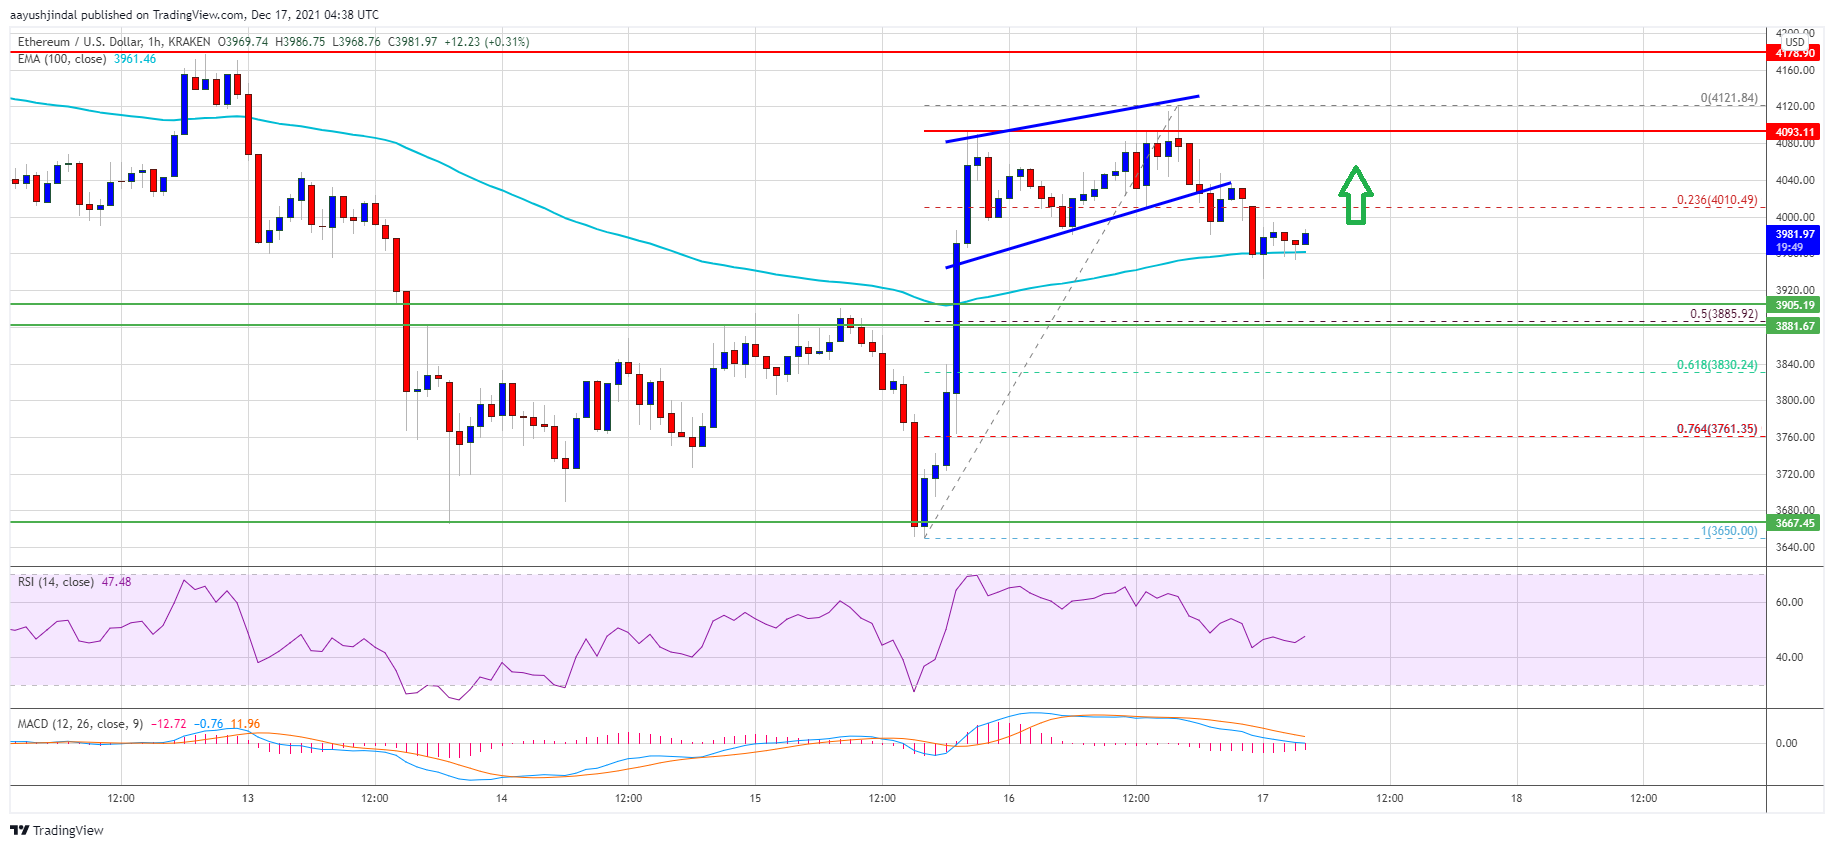
Ethereum has initiated a steady wave of recovery above the resistance levels of $ 3,850 and $ 4,000. ETH even broke through the $ 4,050 level and the 100-hour simple moving average.
However, the price did not continue to break above the resistance levels of $ 4,080 and $ 4,100. A high was formed near $ 4,121 before price began to correct lower. There was movement below the support levels of $ 4,050 and $ 4,000.
There was also a break below a key bullish channel with support near $ 4,040 on the ETH / USD hourly chart. The pair is now trading just above $ 3,950 and the 100 hour simple moving average.
There was a break below the 23.6% Fib retracement level of the move up from $ 3,650 low to $ 4,121 high. Immediate upside resistance is near the $ 4,040 level. The next major resistance is near the $ 4,080 level. A clear move above the $ 4,080 level and the recent rise could start a further increase in the near term.
The next stop for the bulls could be $ 4,120. A close above the $ 4,120 level could potentially trigger a move towards the $ 4,250 level.
More losses in ETH?
If Ethereum fails to start a further rise above the $ 4,040 level, it may continue to fall. Initial bearish support is near the $ 3,950 level.
Key support is now forming near the $ 3,920 level and the 100 hour simple moving average. If there is a clear break below the $ 3,920 support, the price could extend the losses. The next major support is $ 3,885. It is near the 50% Fib retracement level of the bullish move from $ 3,650 low to $ 4,121 high.
Technical indicators
Hourly MACD – The MACD for ETH / USD is slowly losing momentum in the bullish zone.
Hourly RSI – The RSI for ETH / USD is now close to the 50 level.
Major Support Level – $ 3,920
Major Resistance Level – $ 4,040


