

Following the recent release of US employment data, many BTC traders are anticipating significant upward movement. Over the past few days, Bitcoin’s price has exhibited a sideways move, leaving investors looking forward to a potential breakout in the coming week. However, several on-chain data points are now signaling bullish indicators, which could soon restore investor confidence and propel the price above the $30,000 threshold.
Bitcoin’s On-Chain Metrics Suggest a Bullish Trend
Bitcoin price has seen an impressive 30% increase in the last 30 days, retaking the critical level of $28,000. However, traders are now eagerly awaiting BTC’s next price jump to breach the $30,000 barrier.
On-chain indicators look favorable for Bitcoin (BTC), even amid the major digital asset’s sideways price movement this week, as reported by crypto analytics firm Glassnode. Glassnode is keeping a close eye on the miner fee revenue momentum metric, which gauges growing demand in the BTC market.

The analytics company says the metric is currently showing signals of growing Bitcoin demand. The company said that the 90-day simple moving average (SMA) for fees recently exceeded its annual average, indicating that new demand is entering the market.
The firm revealed that, for the first time, open interest on Bitcoin options contracts exceeded that of futures contracts. Bitcoin options contracts currently stand at around $10.3 billion, while futures contracts stand at $10 billion.
Glassnode also noted that open interest on futures has remained relatively flat in 2023. The recent surge in call options suggests that investors are speculating on a higher Bitcoin price going forward.
Additionally, another crypto analytics company, Santiment, reports that Bitcoin traders are currently executing losing trades with a double profit rate, which the company considers a positive development for the market.
Is BTC price approaching $30,000 next week?
Bitcoin’s value has hovered below $29,000 in recent days, with experts expressing mixed opinions on its immediate future. Some analysts are predicting a potential rise to $30,000, while others argue that it may have reached a temporary high.
A symmetrical triangle has emerged near $29,000 in the Bitcoin chart, indicating an equal level of uncertainty among bullish and bearish traders regarding the upcoming price movement of BTC.
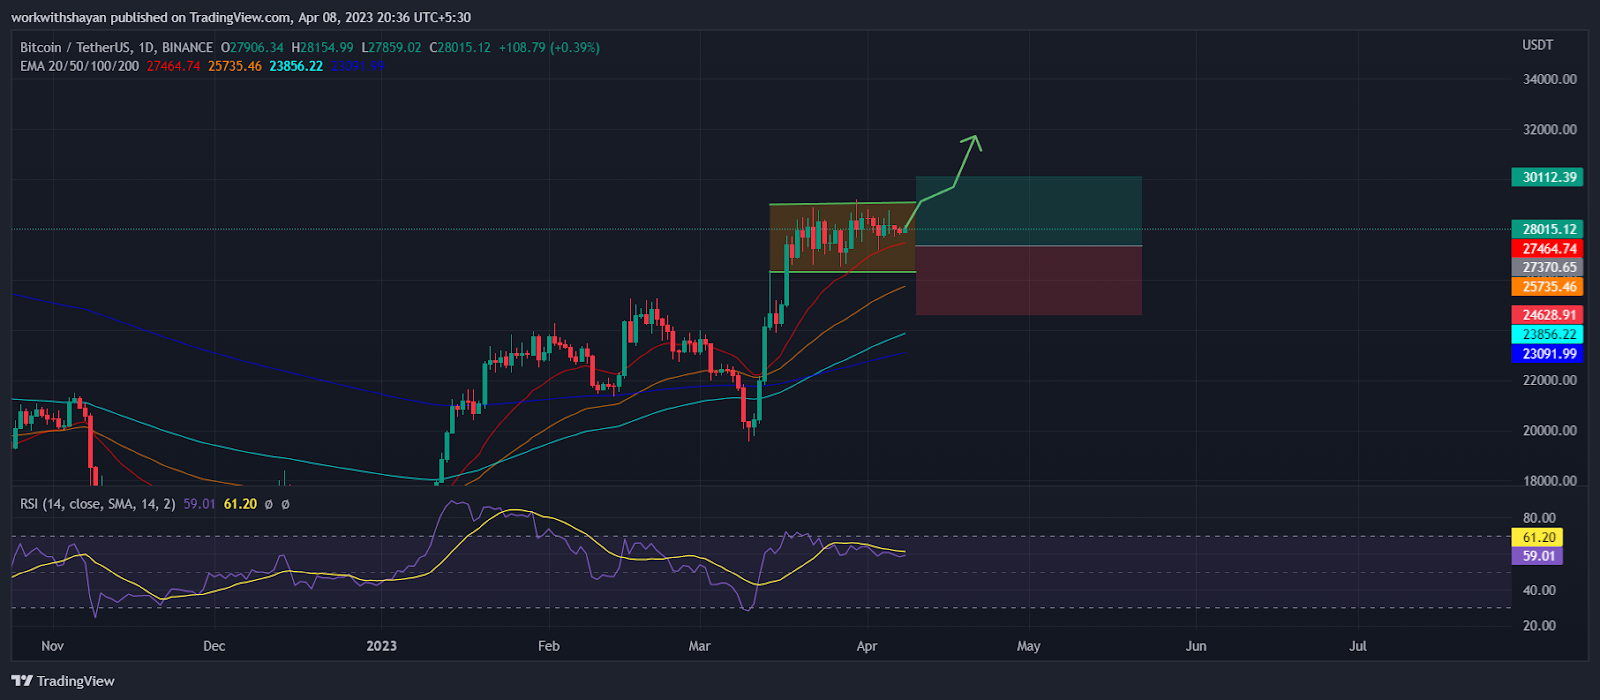
At the time of writing, Bitcoin is trading at $28,000, up 0.37% from yesterday’s performance. Analyzing the daily price chart, the bulls seem to have a slight edge as evidenced by the 20-day EMA ($27,465), which is trending higher, and the higher Relative Strength Index (RSI). at 55.
If Bitcoin breaks above $29,000 by Monday, it could continue its advance and reach the expected bullish target of $30,000. However, a bearish reversal below EMA-20 will send the asset to test its support near $27,000.


