The text below is from a recent edition of Deep Dive, Bitcoin Magazine’s premium markets newsletter. To be among the first to receive this information and other on-chain bitcoin market analysis straight to your inbox, Subscribe now.
In today’s Daily Dive, we highlight the market realized gradient measure coined by Glassnode’s chief on-chain analyst, Checkmate. The measure seeks to capture the current state of market dynamics by comparing price to capital inflows.
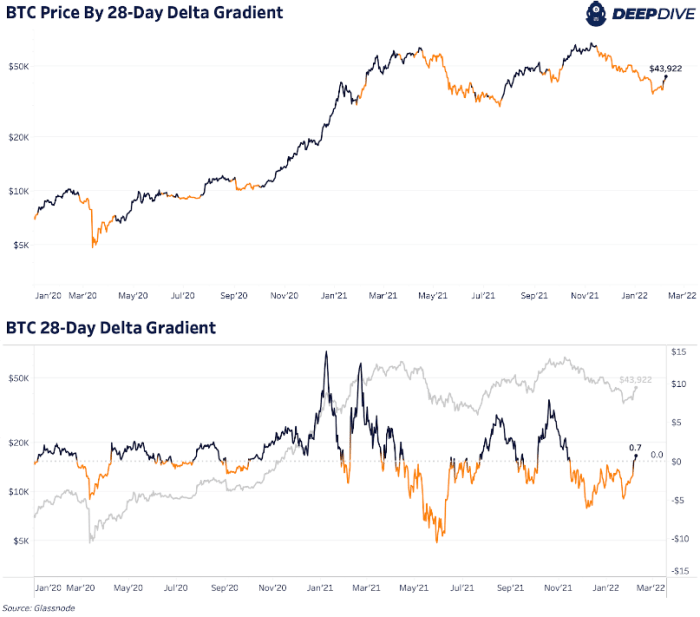
Here we highlight the 28-day delta gradient which examines the difference between the price over the past 28 days versus the realized price difference over the past 28 days with statistical normalization applied. This measures the change in dynamics of speculative value (price) versus true organic capital inflows (realized price). On Glassnode’s Delta Gradient interpretation:
- When the delta gradient is positive, it indicates that an expected uptrend is in play and can be expected to last for a duration similar to the period of the considered oscillator (i.e. i.e., the 28-day delta gradient, suggests a one to two month uptrend is in play).
- When the delta gradient is negative, it signals the opposite, that a downtrend is in play with a similar expected duration.
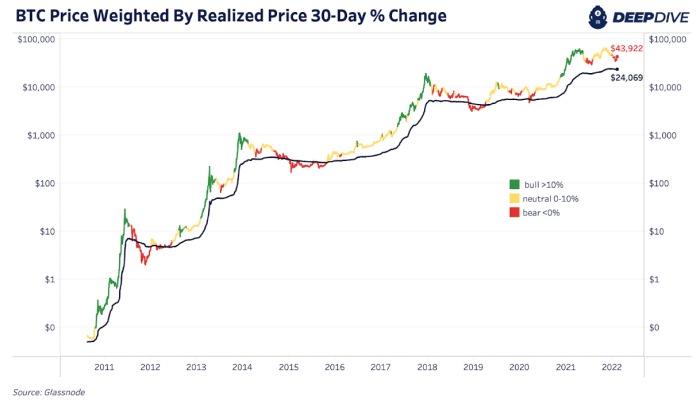
As bitcoin price and market cap move faster than realized price and realized capitalization, we can look for times when there is a possible trend reversal in the price that the realized price has not yet caught up to.
As a reminder, the realized price of bitcoin is the average price of each coin on the network the last time it moved, with a current reading of $24,069.
Detailed bitcoin price data.
Detailed bitcoin price data.
What we have seen over the past couple of days is that the 28-day delta gradient has turned positive indicating market upside over the next month and a potential market bottom is near term. This shows that the on-chain entries have yet to catch up with the latest macroeconomic price reversal.